Competing Risks
This is a case-based continuous-time microsimulation of the competing risks of (multiple) fertility and mortality. The former is sampled using a nonhomogeneous multiple-arrival-time simulation of a Poisson process, with a minimum gap between events of 9 months. Mortality is sampled using a standard nonhomogeneous Poisson process. A mortality event (obviously) precludes any subsequent birth event.
Examples Source Code
The code for all the examples can be obtained by either:
Inputs
Age- and ethnicity-specfic fertility and mortality rates (females only)
Implementation
import numpy as np
import pandas as pd

import neworder as no


class People(no.Model):
    """A simple aggregration of Persons each represented as a row in a data frame"""

    def __init__(self, dt: float, fertility_hazard_file: str, mortality_hazard_file: str, n: int) -> None:
        super().__init__(no.NoTimeline(), no.MonteCarlo.deterministic_identical_stream)

        self.dt = dt  # time resolution of fertility/mortality data

        self.fertility_hazard = pd.read_csv(fertility_hazard_file)
        self.mortality_hazard = pd.read_csv(mortality_hazard_file)

        # store the largest age we have a rate for
        self.max_rate_age = int(max(self.mortality_hazard.DC1117EW_C_AGE) - 1)

        # initialise cohort
        self.population = pd.DataFrame(
            index=no.df.unique_index(n),
            data={"parity": 0, "time_of_death": no.time.FAR_FUTURE},
        )

    def step(self) -> None:
        # sample deaths
        self.population["time_of_death"] = self.mc.first_arrival(
            self.mortality_hazard.Rate.to_numpy(), self.dt, len(self.population)
        )

        # sample (multiple) births with events at least 9 months apart
        births = self.mc.arrivals(self.fertility_hazard.Rate.to_numpy(), self.dt, len(self.population), 0.75)

        # the number of columns is governed by the maximum number of arrivals in the births data
        for i in range(births.shape[1]):
            col = "time_of_baby_" + str(i + 1)
            self.population[col] = births[:, i]
            # remove births that would have occured after death
            self.population.loc[self.population[col] > self.population.time_of_death, col] = no.time.NEVER
            self.population.parity = self.population.parity + ~no.time.isnever(self.population[col].to_numpy())  # ty:ignore[unresolved-attribute]

    def finalise(self) -> None:
        # compute means
        no.log(f"birth rate = {np.mean(self.population.parity)}")
        no.log(f"percentage mothers = {100.0 * np.mean(self.population.parity > 0)}")
        no.log(f"life expexctancy = {np.mean(self.population.time_of_death)}")
Output
"""
Competing risks - fertility & mortality
"""

# model implementation
from people import People  # ty:ignore[unresolved-import]

# separate visualisation code
from visualise import plot  # ty:ignore[unresolved-import]

import neworder

# neworder.verbose()

# create model
# data are for white British women in a London Borough at 1 year time resolution
dt = 1.0  # years
fertility_hazard_file = "examples/competing/fertility-wbi.csv"
mortality_hazard_file = "examples/competing/mortality-wbi.csv"
population_size = 100000
pop = People(dt, fertility_hazard_file, mortality_hazard_file, population_size)

# run model
neworder.run(pop)

# visualise results
plot(pop)
Which can be run like so:
producing something like
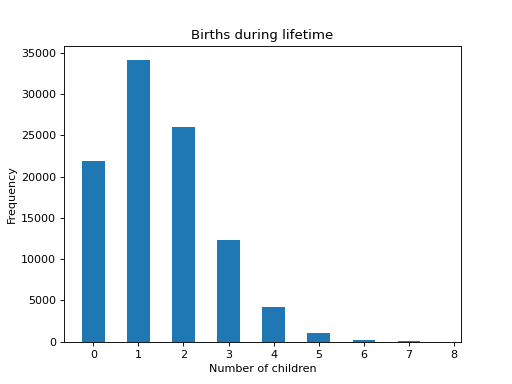
[py 0/1]  birth rate = 1.471500
[py 0/1]  percentage mothers = 78.042000
[py 0/1]  life expexctancy = 81.829173
Although we are sampling the same demographic as the mortality example, life expectancy is over 4 years higher because in this example we are only considering females.
The figures below show the distribution of up to four births (stacked) plus mortality,
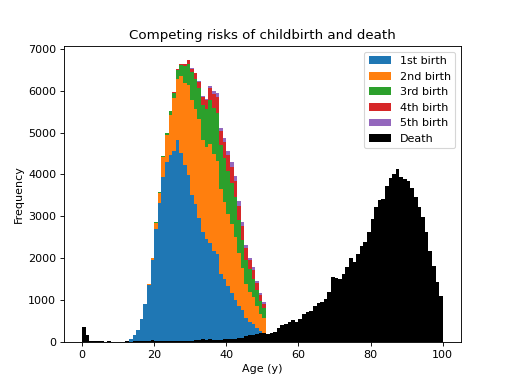
and the distribution of the number of children born to the cohort: